3.2 Analyses of COVID-19 dynamics: regional_analyses.Rmd
This report uses the latest clean data to perform a range of analyses for a specific WHO region. Analyses include estimation of the growth rate, detection of trend changes using ASMODEE, and figures summarising the overall dynamics of COVID-19 by country (pinplots and tadpoles).
3.2.1 Inputs
The latest data are automatically detected and loaded by the auxiliary function
load_final_data(), defined in scripts/data_loaders.R
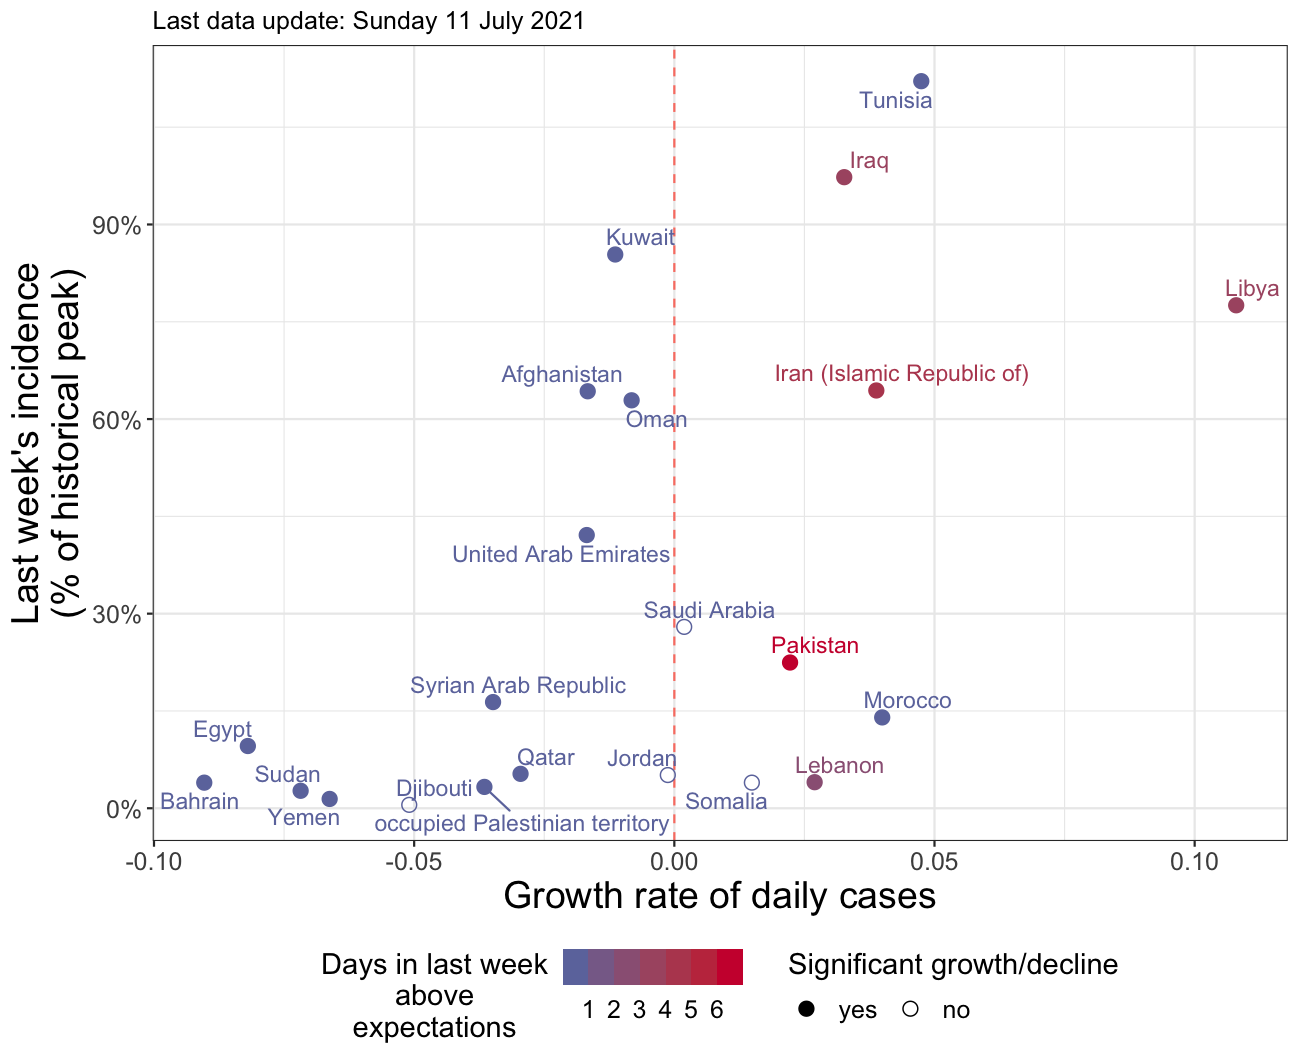
Figure 3.1: Example of pinplot. This figure summarises the dynamics of COVID-19 at a national level, using three complementary metrics: the daily growth rate r (x axis), the currentl weekly incidence (y axis), and the number of net increases showing trend acceleration detected by ASMODEE (colors). Another variant of this figure uses weekly incidence of deaths per capita on the y axis. Countries to the right show faster epidemic growth, and countries near the top experience high levels of incidence. Countries displayed in red show signs of acceleration, so that they may move further to the right in the coming days. This figure was generated for EMRO on 11th July 2021.
3.2.2 Outputs
The main output of the report is a list exported as a file named
asmodee_outputs[WHO region][data].rds stored in /asmodee_outputs/rds/, and
containing the following elements:
$summary: summary of the ASMODEE results$results: outputs of ASMODEE$plot_overall_deaths: ggplot2 object of the overall dynamics plot using death per capita on the y-axis$plot_overall_peaks: ggplot2 object of the overall dynamics plot using incidence as percentage of historical peak on the y-axis$df_dynamics: adata.framecontaining all the required info to recreate either global dynamics plots$elr_extras: adata.framecontaining additional information for countries, including TPR and vaccination coverage$timestamp: the timestamp corresponding to the date of the dataset used in the analyses
Other outputs include:
pinplots and tadpoles figures saved asmodee_outputs/png/; these figures summarise the COVID-19 dynamics according to the growth rate, the current weekly incidence, and the number of net accelerations identified by ASMODEE; pinplots show the current situation (see example in Figure 3.1, while tadpoles show the trajectories of countries over the last few days
notes listing countries what were excluded from the analyses alongside the reason for their exclusion, stored in a markdown file named analysis_notes[WHO region][data].md stored in /asmodee_outputs/notes/
3.2.3 Parameters
The report accepts the following parameters:
who_region: the code of the WHO region used in the analyses; possible values are (keep the upper case):AFRO,EMRO,EURO(default),PAHO,SEARO,WPROn_cores: the number of cores/processors to be used for ASMODEE; as the method supports parallelisation, more cores usually mean faster analyses; defaults to 1 (no parallelisation)tadpole_size: the number of days to be considered when showing the trajectories of the countries on tadpoles plots; defaults to 7
3.2.4 Example compilation
The following instructions will compile the report for EMRO, using 12 cores for
the calculations; also note the use of subfolder which will ensure that
results are stored in a timestamped folder in outputs/EMRO/ (rather than in
outputs/):
library(reportfactory)
rmarkdown::render('regional_analyses',
                  params = list(n_cores = 12, who_region = "EMRO"),
                  subfolder = "EMRO")
The following loop will do the same but for every region: