4.3 Capturing periodicity
Periodic changes are often observed due to either seasonality (over long time scales for seasonal diseases such as influenza), but are also frequent in the case of COVID-19 due to reporting artifacts (Figure 4.2. For instance, some countries report less cases over a weekend, followed by a spike on the following day (backlog effect).
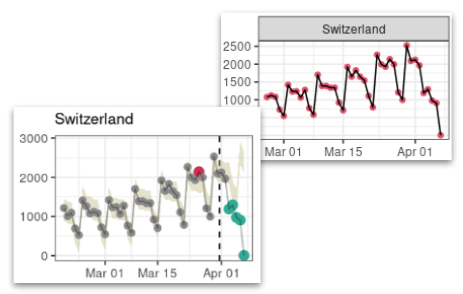
Figure 4.2: Example of periodicity in COVID-19 data. This figure illustrates a case of weekly periodicity in raw data (red dots and plain black line) captured by ASMODEE (grey dots and model envelope).
Such trends can be captured by different predictors:
- a strict
weekendeffect, i.e. a categorical variable distinguishing weekends from weekdays - a
weekendeffect including a backlog effect, i.e. a categorical variable distinguishing weekends, Mondays, and other weekdays - a
weekdayeffect, i.e. a categorical variable distinguishing each day in the week
At the time of writing, only 2 and 3 are used in the data pipelines. Option 2)
is implemented by the function day_of_week() in the scripts/ folder, also
provided below. Option 3) is implemented in base R by weekdays. Both functions
generate categorical variables from a Date input; for instance:
#' Convert dates to factors
#'
#' This will map a `Date' vector to weekdays, with the following
#' distinction:
#' weekden, monday, of the rest of the week
#'
#' @author Thibaut
#'
#' @param date a vector of `Date`
#'
day_of_week <- function(date) {
  day_of_week <- weekdays(date)
  out <- vapply(
    day_of_week,
    function(x) {
      if (x %in% c("Saturday", "Sunday")) {
        "weekend"
      } else if (x == "Monday") {
        "monday"
      } else {
        "rest_of_week"
      }
    },
    character(1)
  )
  factor(out, levels = c("rest_of_week", "monday", "weekend"))
}

# generate some dates for the example
some_dates <- as.Date("2021-02-04") + 0:9
some_dates
##  [1] "2021-02-04" "2021-02-05" "2021-02-06" "2021-02-07" "2021-02-08"
##  [6] "2021-02-09" "2021-02-10" "2021-02-11" "2021-02-12" "2021-02-13"

# build new variables using dplyr
library(magrittr)
library(dplyr)
tibble(date = some_dates) %>%
  mutate(weekend = day_of_week(date), weekday = weekdays(date))
## # A tibble: 10 x 3
##    date       weekend      weekday
##    <date>     <fct>        <chr>
##  1 2021-02-04 rest_of_week Thursday
##  2 2021-02-05 rest_of_week Friday
##  3 2021-02-06 weekend      Saturday
##  4 2021-02-07 weekend      Sunday
##  5 2021-02-08 monday       Monday
##  6 2021-02-09 rest_of_week Tuesday
##  7 2021-02-10 rest_of_week Wednesday
##  8 2021-02-11 rest_of_week Thursday
##  9 2021-02-12 rest_of_week Friday
## 10 2021-02-13 weekend      Saturday