2.1 Overview of the infrastructure
The infrastructure implements data pipelines that download national COVID-19 data from online sources, performs some analyses, classify countries by epidemiological level of risk (ELR) and produce synthesis reports which can be emailed to a pre-defined list of recipients. It is summarised in figure 2.1. The infrastructure itself is a reportfactory, which provides a structure for storing data, auxiliary scripts, reports sources and their outputs. Its key components include:
- a set of Rmarkdown reports detailed in chapter 3
- a set of github actions implementing automated tasks on github servers, and detailed in chapter 5
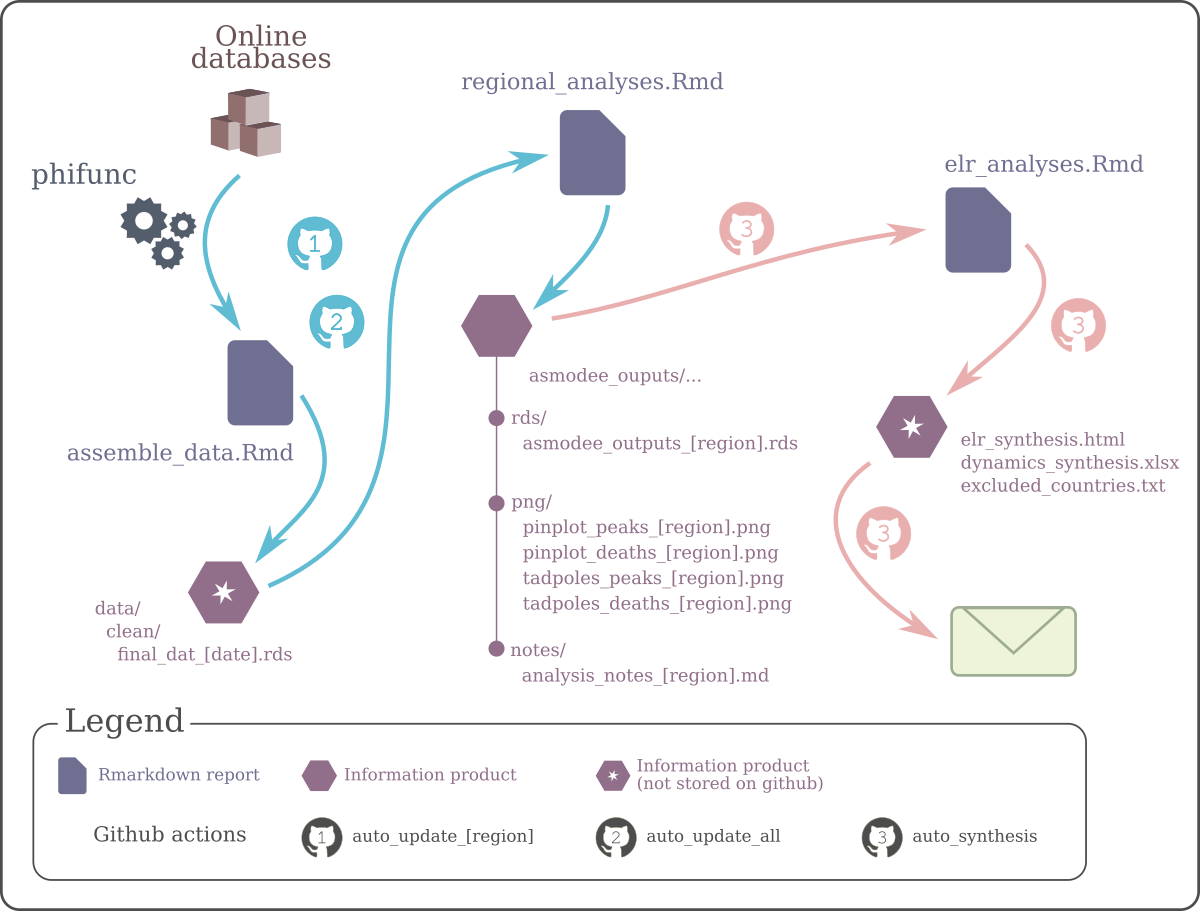
Figure 2.1: Overview of the infrastructure. This diagram represents the flow of information processed by the data pipelines. Data are gathered from the net by the WHO-private package phifunc, and processed by a series of Rmd reports. Some of the information products generated, indicated by a star, are not stored on github in order to reduce the size of the repository. Upon compilation, all reports outputs are stored in an /outputs/ folder (not shown on the diagram). The automated email (last step) can only be sent by github actions, as it requires SMTP credentials only stored as github secrets.